Things should be made as simple as possible, but not any simpler.
Albert Einstein
The following is a brief introduction to what pharmacometrics is all about. Pharmacometrics or population pharmacokinetic/pharmacodynamic (PK/PD) modeling is a mathematical/statistical way of describing clinical data over time using so-called longitudinal mixed-effects models. The data are typically repeated measurements in healthy study participants and patients over time.
Pharmacokinetics is what the body does to the drug: once a drug enters a body the body absorbs, distributes, and eliminates the drug.
Pharmacodynamics is what the drug does to the body: effects that are caused by exposure to the drug. These include wanted effects (efficacy) and unwanted effects (safety, that is, adverse events or side effects).

Left: concentration-time curve for a drug that is taken orally.
Right: relationship between drug concentration and effect.
Pharmacometrics, also known as pharmacokinetic/pharmacodynamic (PK/PD) modeling, is the discipline of quantitative modeling and simulation to support drug development decision making. A model describes pharmacokinetics and pharmacodynamics in form of a mathematical model. A PK model commonly describes drug flow in the body, and a typical result is a prediction of drug concentration over time for a given body. A PD model in turn relates drug concentration or exposure to an effect.
PK/PD models are commonly based on data. A mathematically defined class of models is fitted to the data such that the model describes the data best. The models are built on data, and the general assumption is that the model includes all relevant information contained in the data. A key feature of a pharmacometric model is that it can aggregate a variety of different information (different doses, different dosing schemes, different observation times, different bodies) into a single model (in contrast to summary statistics or noncompartmental analysis). The model comprises population parameters (e.g., for absorption, distribution, elimination, and concentration-effect relationships) as well as measures of variability and uncertainty.
The final model is assumed to contain all relevant information of all data gathered thus far. Future scenarios can be derived and simulated from the final model.
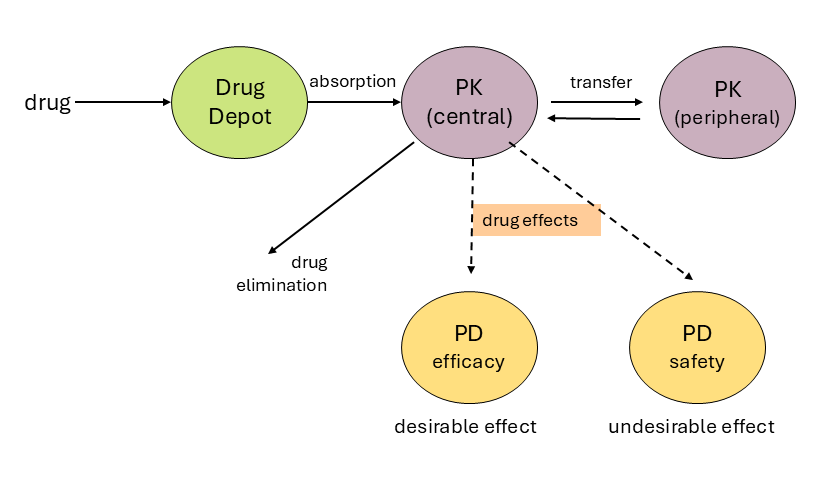
Solid arrows indicate drug flow, dashed lines indicate effects.
The figure shows a typical model structure to describe pharmacokinetic and pharmacodynamic model components. Solid arrows indicate drug flow, dashed arrows indicate effects. The related pharmacokinetic parameters may be drug absorption rate, distribution rates, metabolism/elimination rates, and effect of drug concentration on clinical responses (efficacy, i.e., therapeutic effect, and safety, i.e., undesirable effects also known as side effects).
Simulations are based on the model. Given the input specifications (dose, dosing scheme, body characteristics, and variability in parameter estimates), a prediction of drug concentration and effect can be derived from the model. Simulations of large populations allow for an assessment of the distribution of drug exposure and effects and quantification of the distribution (e.g., 7% of the simulated population showed an undesirably low effect).
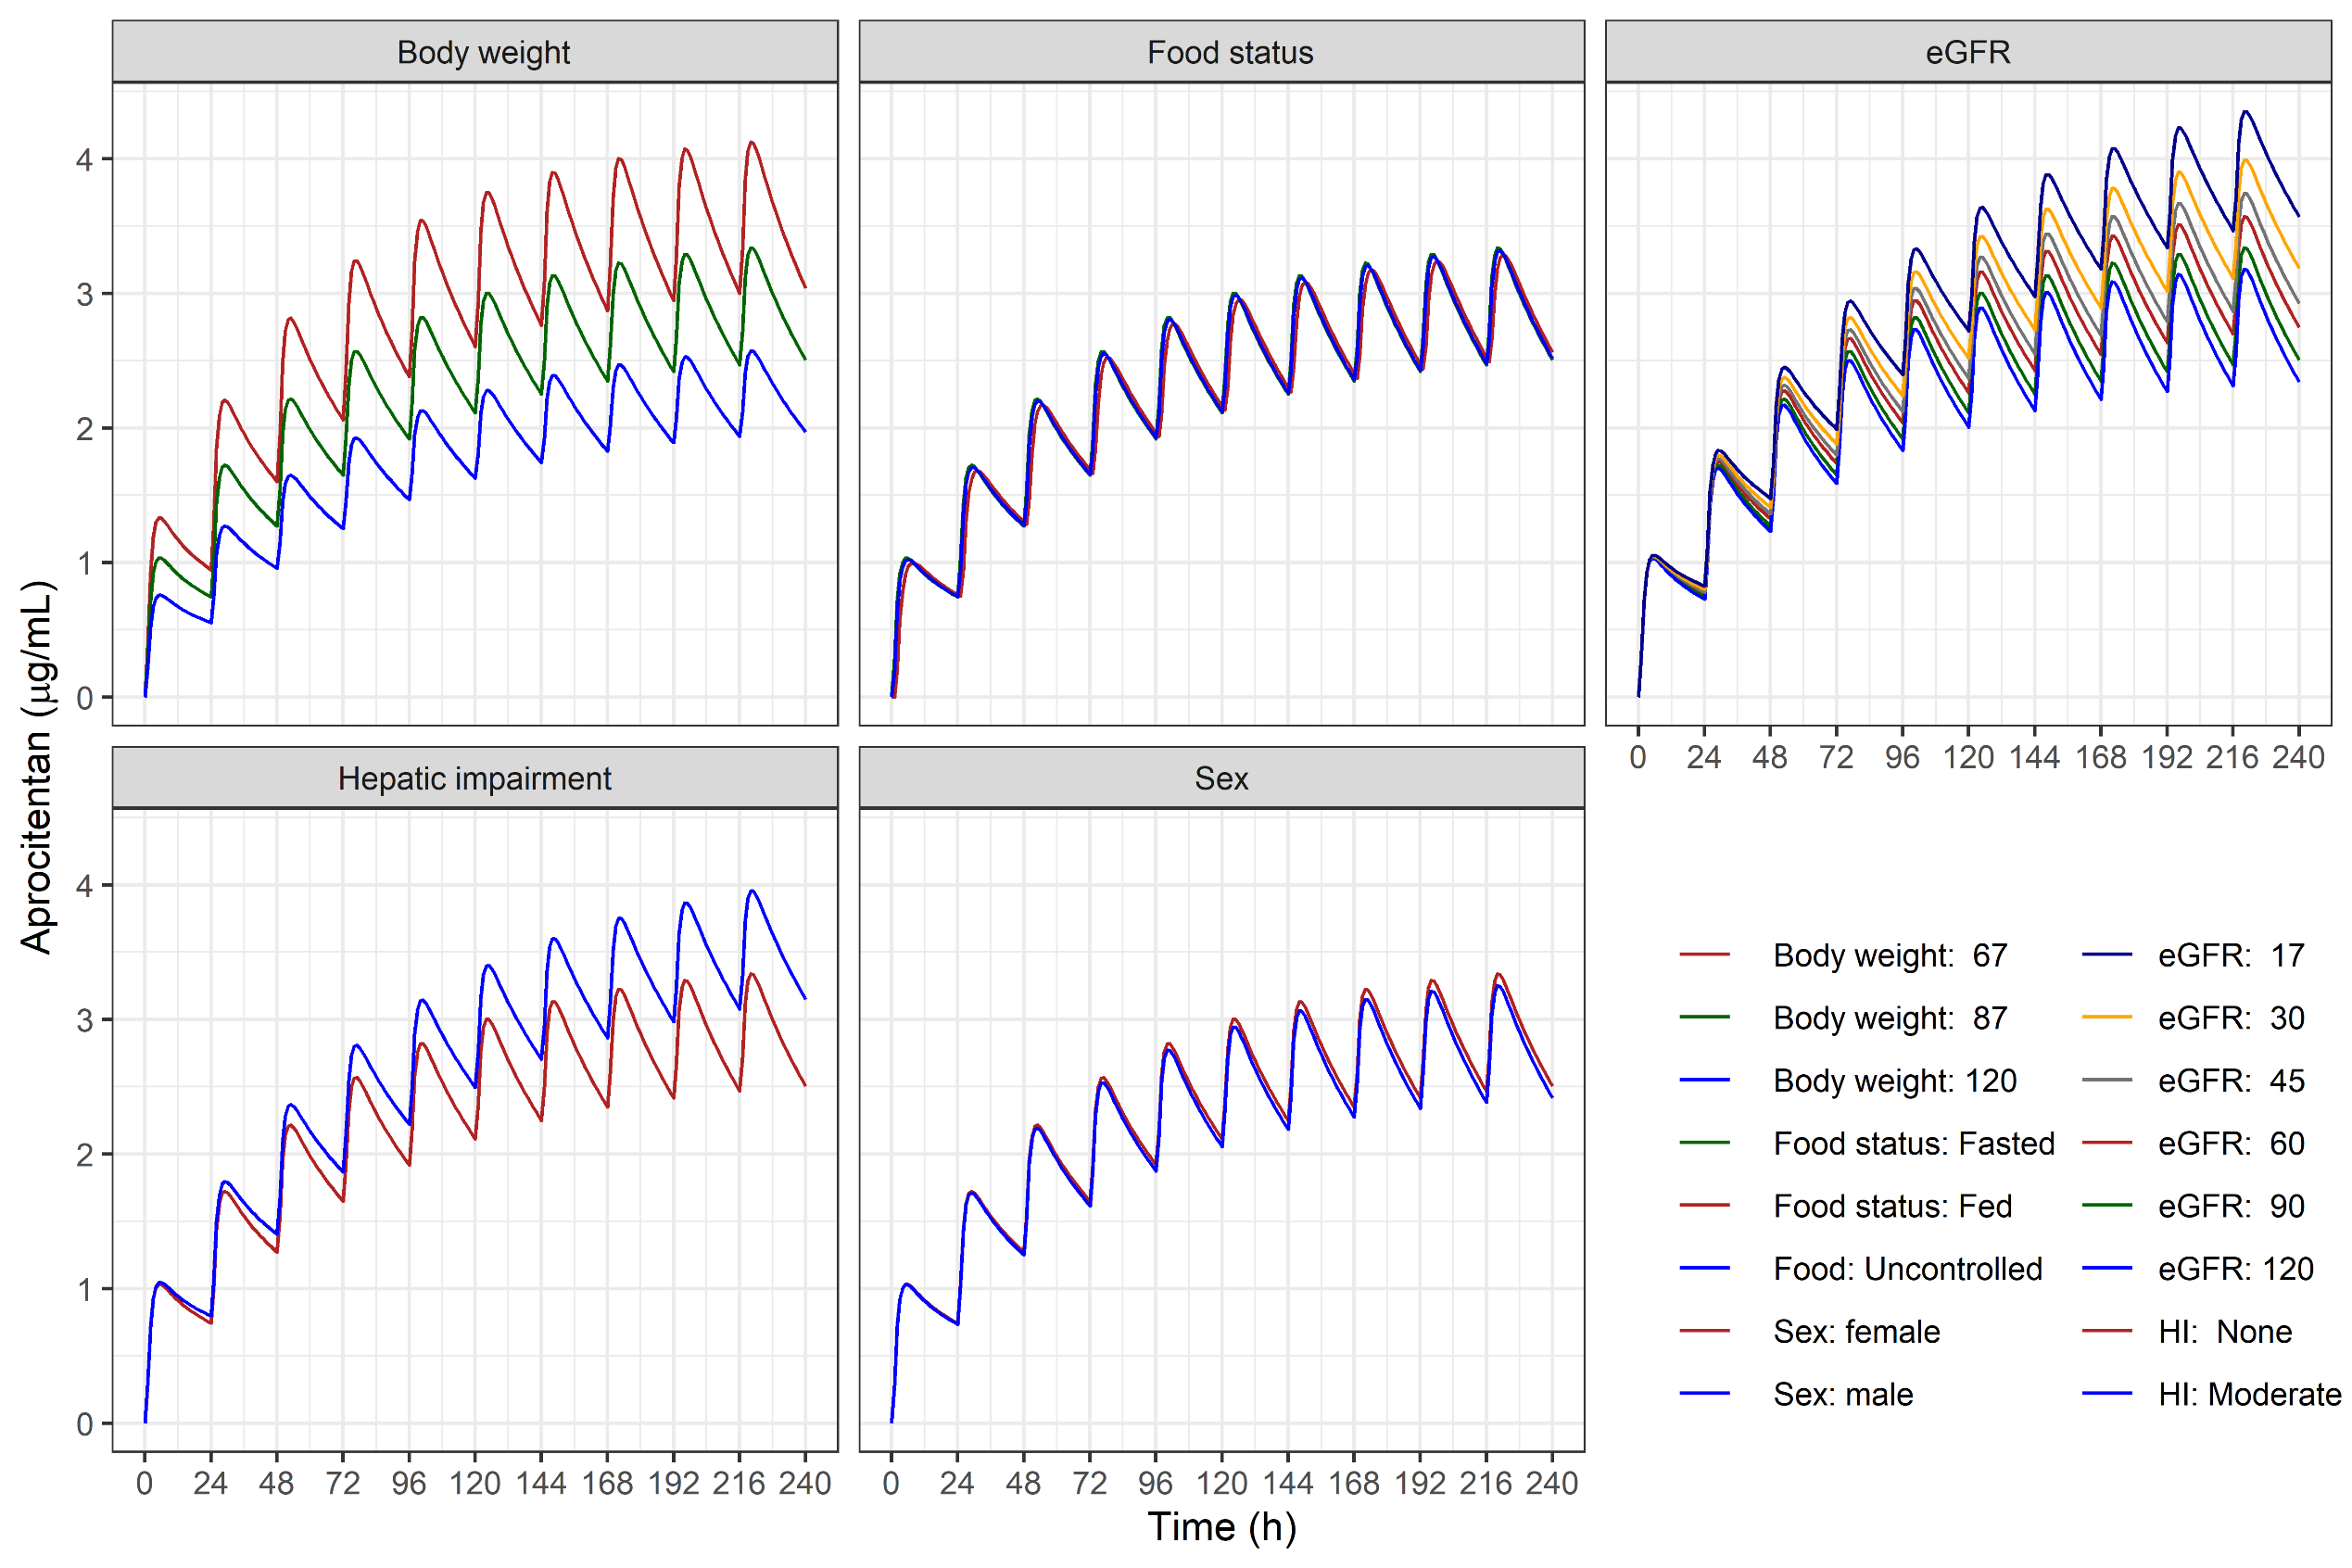
In: Brussee, Sidharta, Dingemanse, and Krause: Population pharmacokinetics of the dual endothelin receptor antagonist aprocitentan in subjects with or without essential or resistant hypertension. JPKPD 2024. DOI:10.1007/s10928-024-09902-1
Applications include prediction of drug exposure and effects (e.g., for doses or dosing regimens that have not been studied yet or for bodies that have not been studied yet, including extrapolation from adults to children). As an example, consider a drug that lowers the lymphocyte count. Simulations allow for estimation of the percentage of patients reaching critically low lymphocyte counts at steady state.
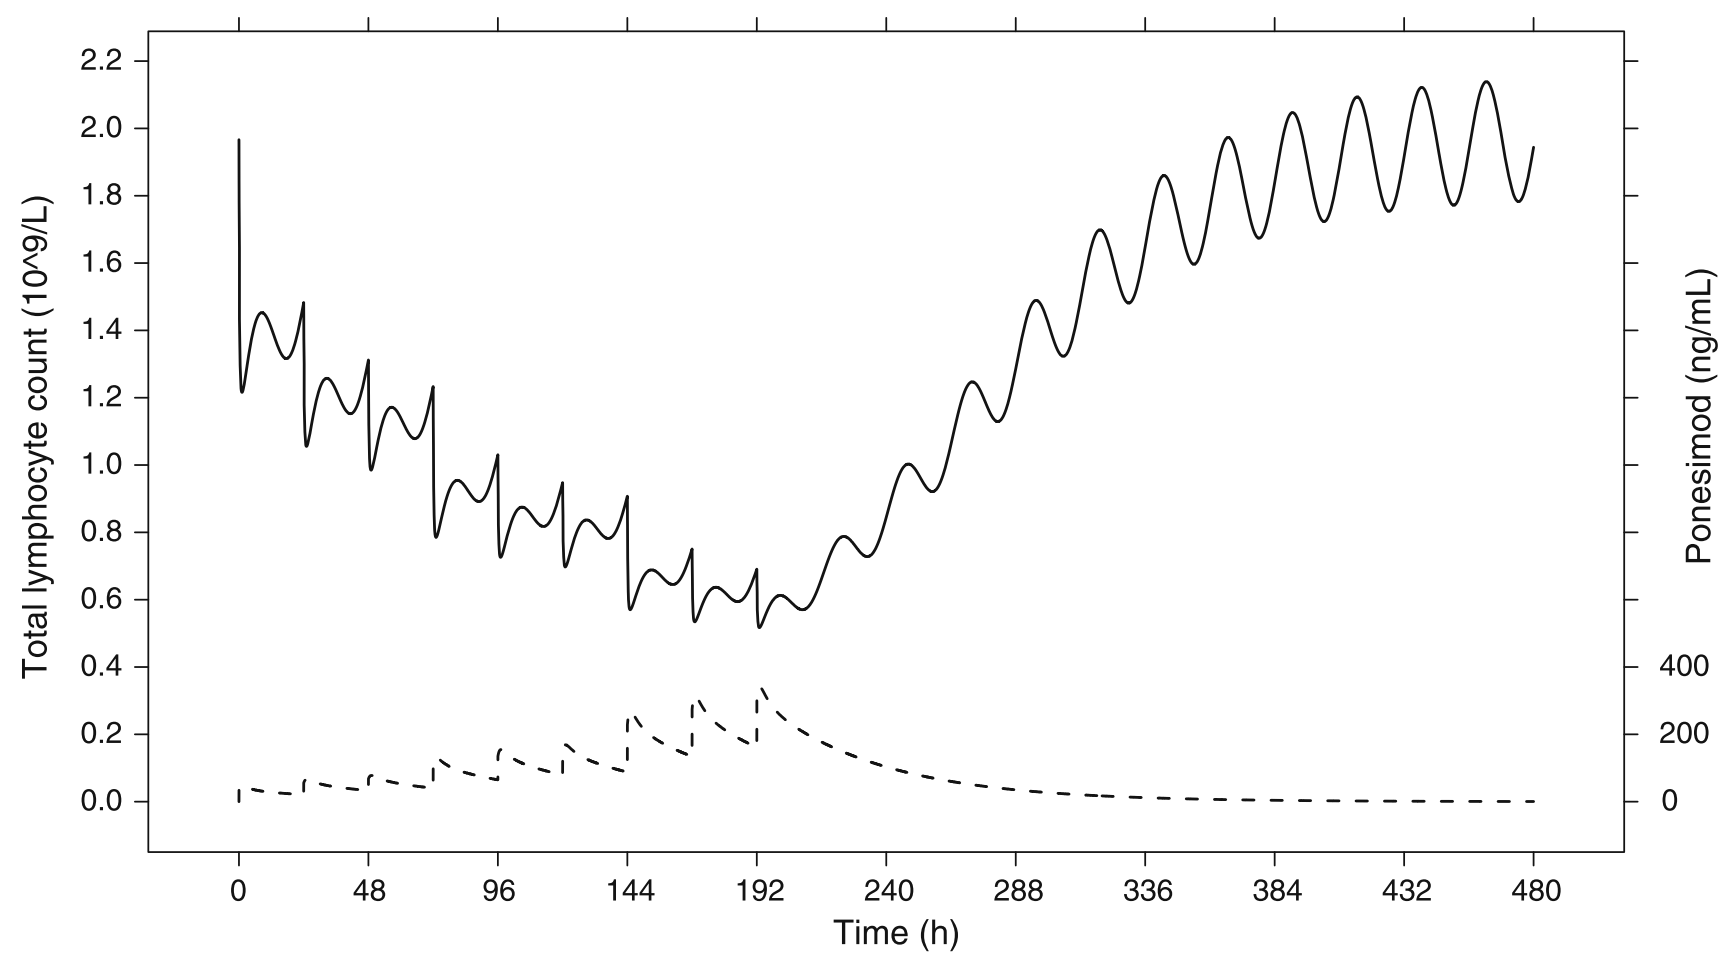
In: Krause, Brossard, D’Ambrosio, Dingemanse: Population pharmacokinetics and pharmacodynamics of ponesimod, a selective S1P1 receptor modulator. JPKPD 2014. DOI:10.1007/s10928-014-9362-4
Applications can assess inter-individual variability and uncertainty, too. For example, a large population can be simulated, say, 1000 patients. These simulated patients can subsequently be used to estimate the fraction of patients reaching specified clinical thresholds for efficacy or safety. A real-life application is demonstrated in Lott, Lehr, Dingemanse, and Krause, modeling a drug’s effect on heart rate and estimating the percentage of bradycardia cases, an undesired effect (DOI: 10.1002/cpt.877).