The purpose of visualization is insight, not pictures.
Ben Shneiderman
You can see a lot by just looking.
Yogi Berra
A variety of case studies of our works is shown below, always accompanied by a key visualization driving home the message.
Visualization can be more impactful than numerical analysis
A clinical researcher hypothesized that a biomarker, white blood cell count, might be a useful biomarker and predictor of clinical outcome in leukemia patients. Data were available for some 20 patients. Instead of analyzing the data using statistics or modeling, all the raw data were visualized. The team pondered over the graphics for hours and was very satisfied to be able to see everything unprocessed.
Reference:
A picture is worth a thousand tables.
Krause and O’Connell. Springer NY 2012

Population pharmacokinetics: the effect of individual characteristics
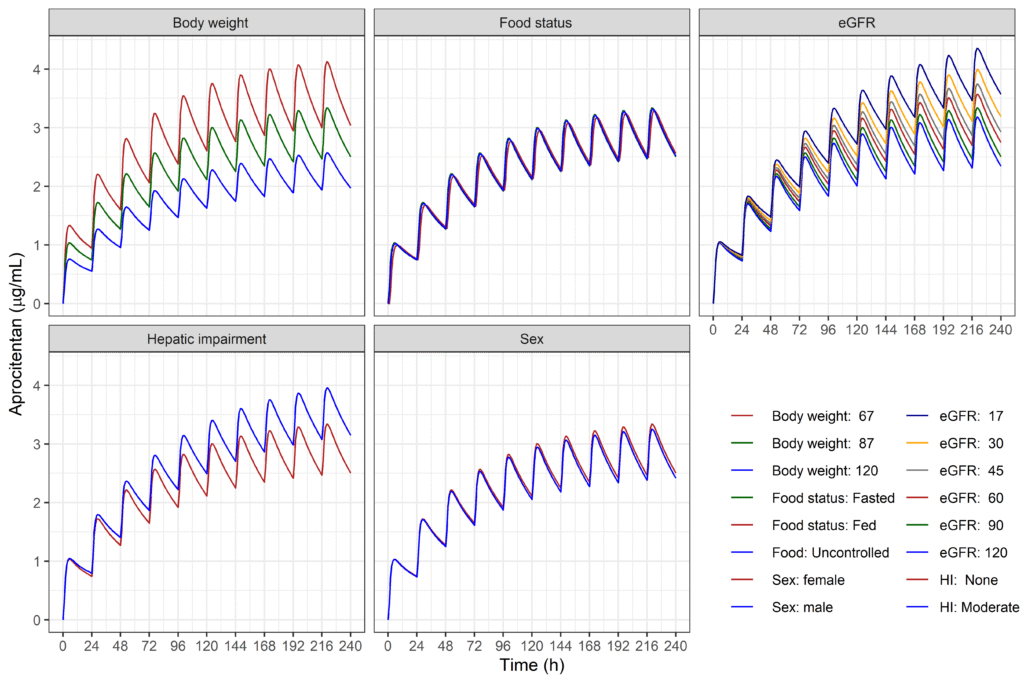
The pharmacokinetics of aprocitentan were characterized by a population model (characterizing the typical patient). Covariates were included into the model to assess the clinical relevance of differences between patients (body weight, age, sex, food status, hepatic and renal function). Visualizations enable assessment of differences between different patients, in turn allowing for deciding on the necessity of different doses for different patients.
Reference:
Population pharmacokinetics of the dual endothelin receptor antagonist aprocitentan in subjects with or without essential or resistant hypertension.
Brussee, Krause, Sidharta, Dingemanse.
JPKPD 2024
Proof of concept: go/no-go decision
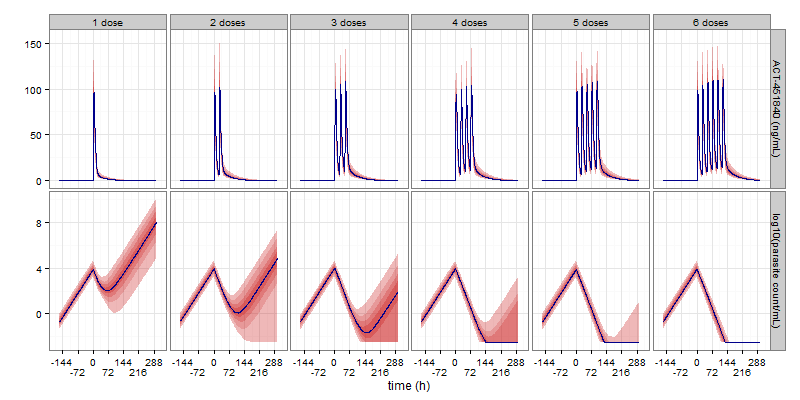
With clear targets, cure of malaria with a single dose in 90% of patients, the entire clinical program consisted of just two studies: an entry-into-man safety study and a proof-of-concept challenge study where 8 healthy subjects received the malaria parasite followed by the candidate treatment and followed by standard-of-care malaria treatment. Modeling was employed to predict percentages of subjects being cured with single doses of different strengths and percentages of subjects being cured with multiple doses.
From the issue highlights of the British Journal of Clinical Pharmacology: “Experimental infection with malaria sounds frightening but can be done safely and gives great opportunities for quantitatively evaluating treatment effects of new medicines. Andreas Krause and colleagues give a beautiful example of how to do this, using a challenge test in healthy subjects and turning these findings into a mathematical model. Essential reading for anyone interested in how to develop an antimalarial drug rationally and quantitatively.”
Reference:
Pharmacokinetic- pharmacodynamic modelling of the antimalarial effect of ACT-451840 in a challenge study in healthy subjects.
Krause, Mathis, Möhrle, Dingemanse, McCarthy.
BJCP 2016, editorial highlights
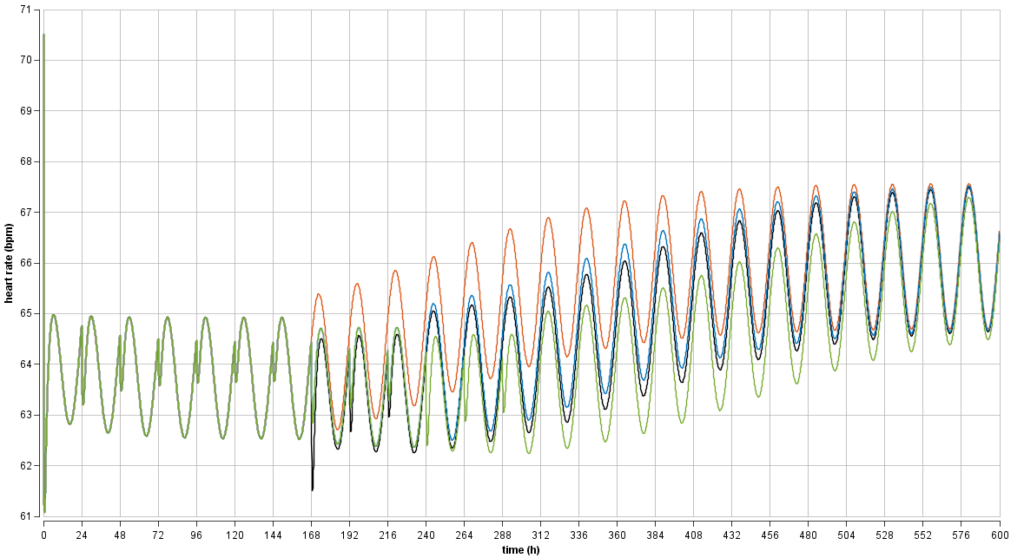
Drug safety: optimization of an uptitration dosing regimen
An undesired drug effect, lowering of the heart rate, reduced over multiple doses (tolerance developed). Model-based optimization of an uptitration regimen yielded a smooth heart-rate effect curve to achieve acceptable safety in multiple sclerosis patients. The new uptitration regimen was implemented in clinical Phase 3 studies with thousands of patients. The uptitration and recommendations for how to continue after missed doses are included in the US prescribing information.
References:
US prescribing information (link)
Modeling Tolerance Development for the Effect on Heart Rate of the Selective S1P1 Receptor Modulator Ponesimod.
Lott, Lehr, Dingemanse, and Krause.
CPT 2017
Drug safety: QT liability assessment
Following the white paper (link), a drug’s QT liability in the ECG is assessed based on a concentration-QT regression model. The response is defined as the placebo-corrected change from baseline of the QT interval duration in the ECG (DDQTc). QT liability is assumed if the 90% confidence interval at clinically relevant concentrations is not entirely below 10 ms.
References:
ICH E14: 20 years of assessing QT liability.
JPKPD special issue 2025
Beyond the linear model in concentration-QT analysis. JPKPD 2025
PK/PD modeling of a clazosentan thorough QT study with hysteresis in concentration-QT and RR-QT. JPKPD 2021
Modeling time‐delayed concentration‐QT effects with ACT‐1014‐6470, a novel oral C5a1 receptor antagonist. PRP 2023
Daridorexant […] concentration-QT analysis. CDI 2021
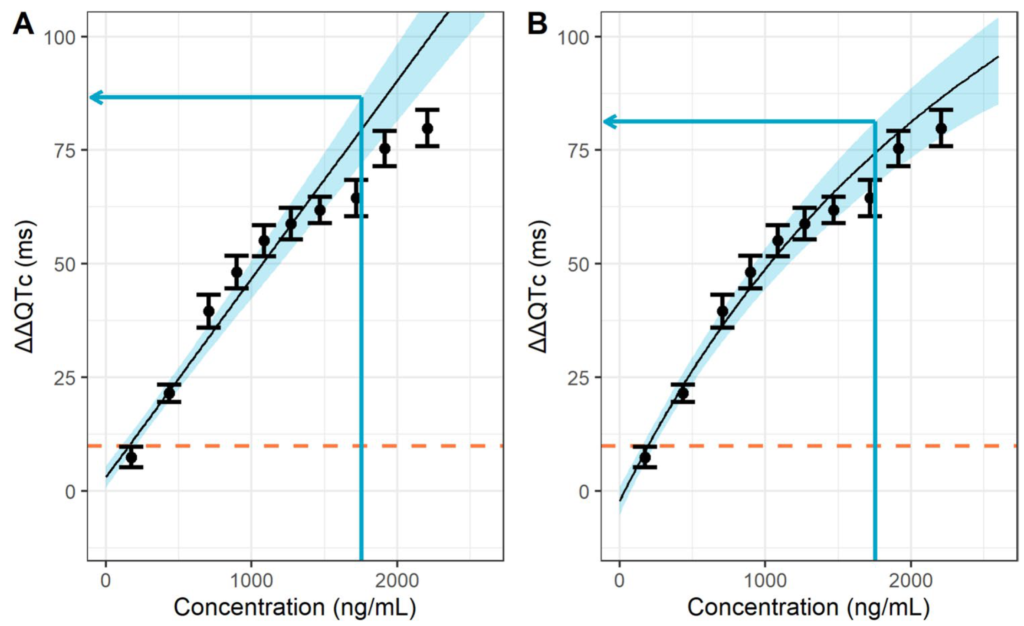
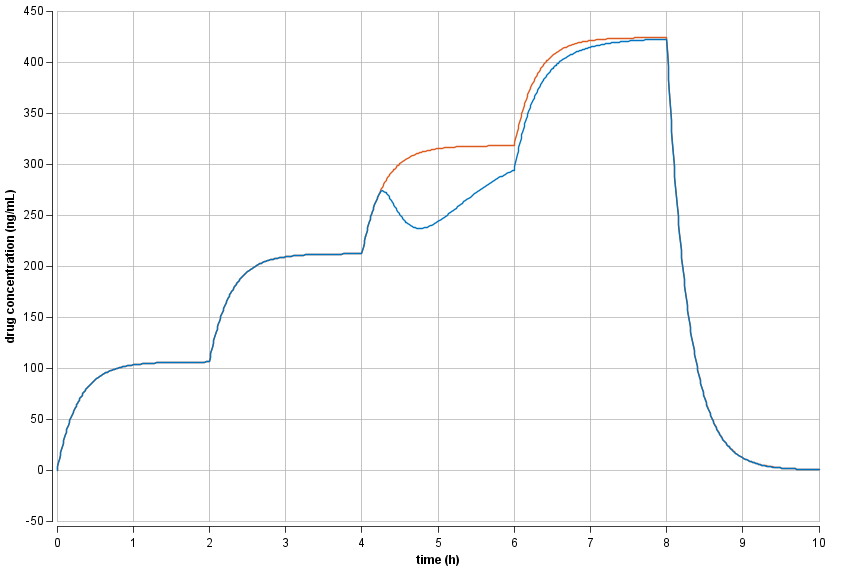
Red line: 10-ms threshold. Black line: Emax model fit. Blue area: 90% confidence interval. Black intervals and bullets: means and 90% confidence intervals from 10 equally sized observation intervals. Time-delayed effects: changes in DDQTc effect (colored, left axis) follow changes in concentration (black, right axis) with a time delay.
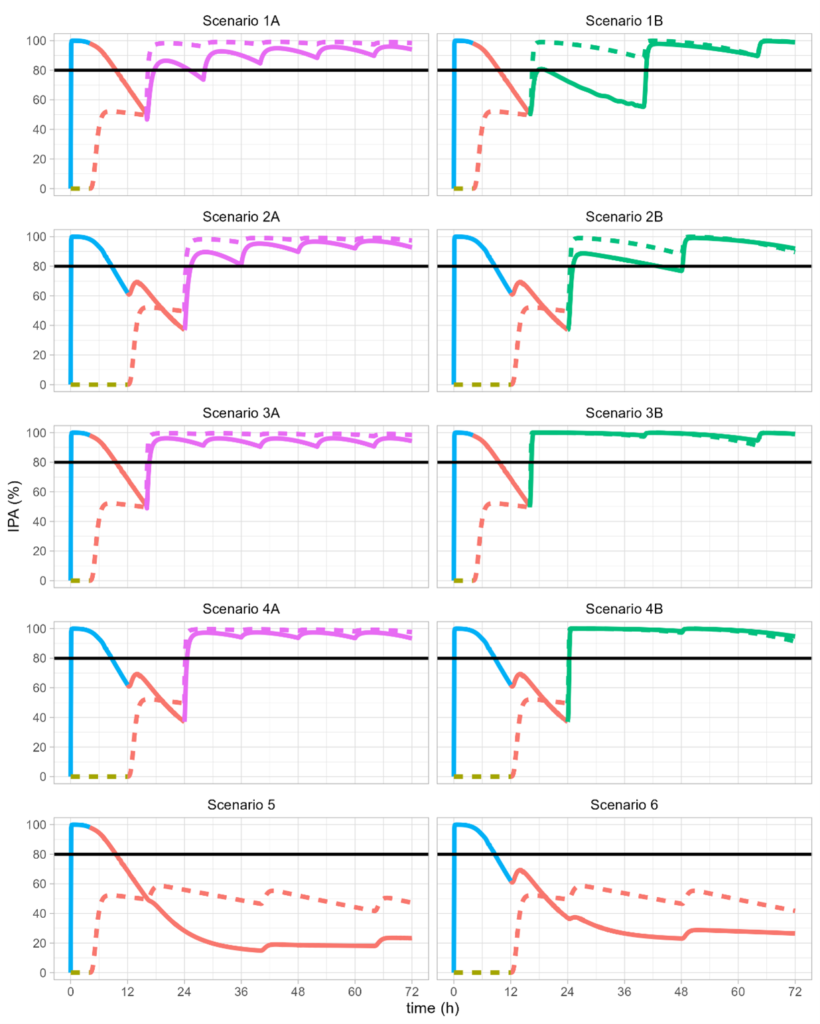
Drug interaction modeling
Selatogrel is in clinical development for self-administration on symptoms of myocardial infarction (heart attack). The initial emergency treatment is followed by standard-of-care treatments that vary globally. All possible treatments, selatogrel, ticagrelor, clopidogrel, prasugrel, bind competitively to the P2Y12 receptor, such that sequence and timing of drug administration are highly relevant.
References:
Mind the Gap: Model-Based Switching from Selatogrel to Maintenance Therapy with Oral P2Y12 Receptor Antagonists. Hsin, Bernaud, Gehin, Dingemanse, Krause, Biomolecules 2023
Pharmacokinetic/ pharmacodynamic modeling of drug interaction at the P2Y12 receptor for selatogrel and oral P2Y12 antagonists. CPT:PSP 2021
Modeling of food effect on drug concentration
A PK model with food effect on bioavailability characterized increased drug clearance after food intake. Food given 4 h after start of treatment showed pronounced decreases of systemic drug concentration.
Reference:
Integrated pharmacokinetics and pharmaco-dynamics of epoprostenol in healthy subjects.
Nicolas, Krause, Gutierrez, Dingemanse.
BJCP 2010
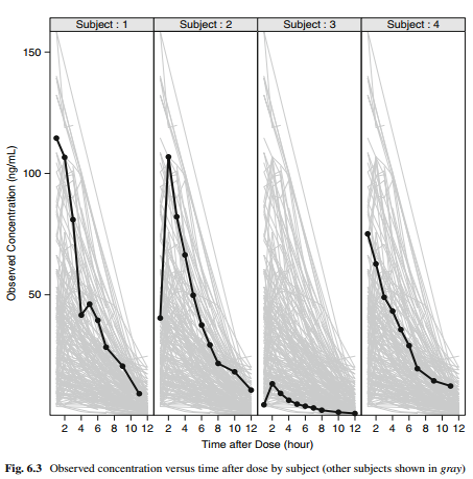
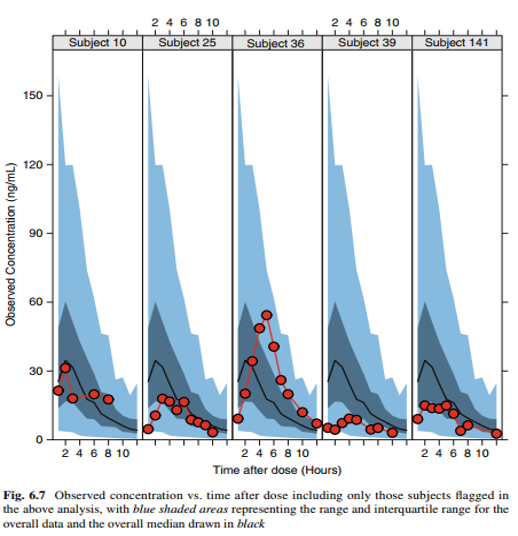
Visualization of individual PK profiles
Individual concentration-time profiles of, say, unusual profiles, can easily be placed into context if the context is shown, that is, if the data of interest are shown in the context of all other data.
The two visualizations show individual profiles with all other profiles in the background and individual profiles in the context of the empirical quantiles of all data.
Reference:
Visualization Concepts for Modeling and Simulation. Dykstra, Pugh, Krause. JCP 2010